 DAILYINFOGRAPHICS.EU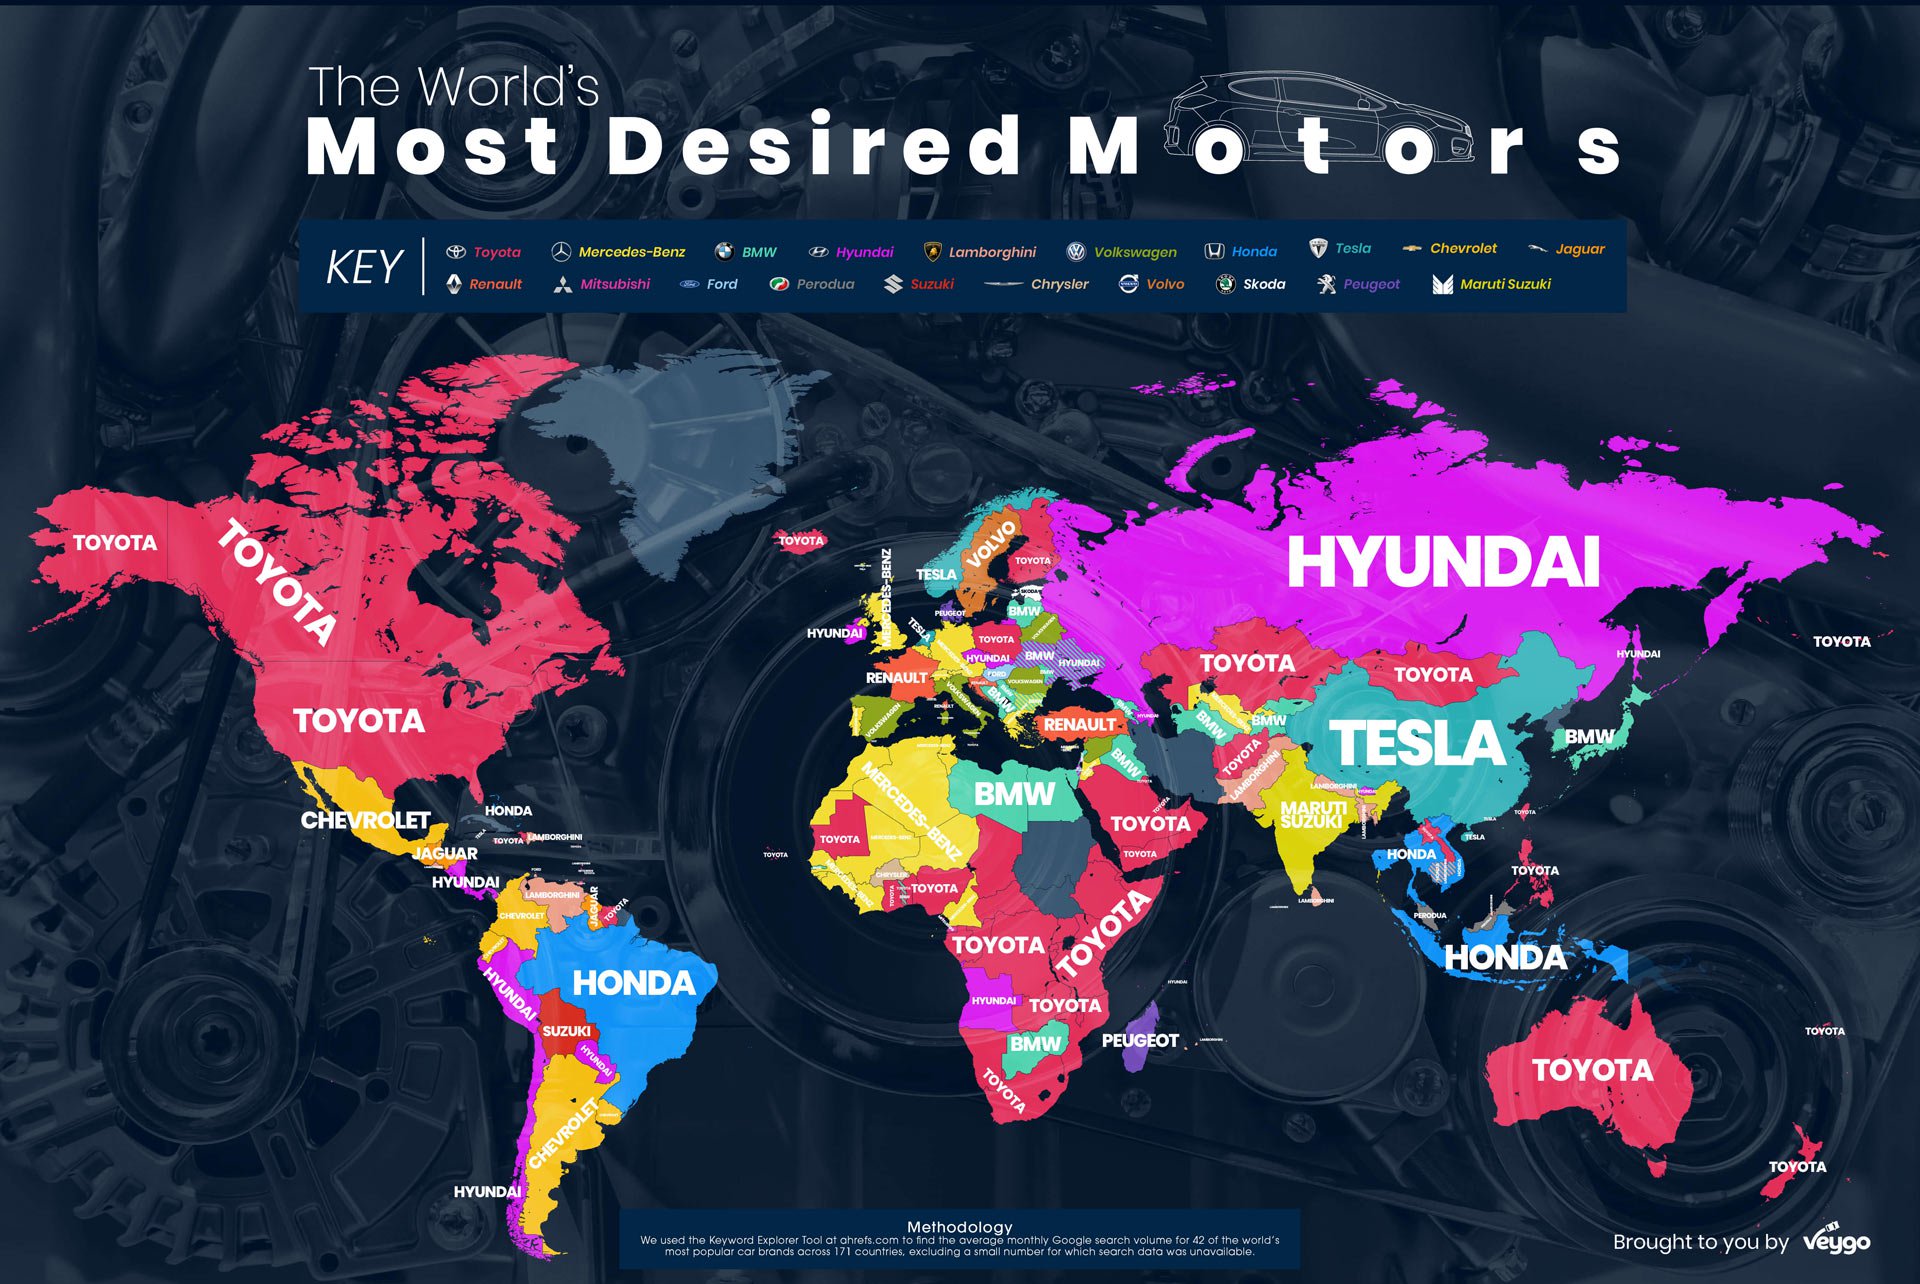
This map answers a narrower question than it looks like: not which brand sells the most cars in each country, but which brand people search for most on Google. That distinction matters — a brand can dominate search interest without dominating the road, and vice versa. The underlying data comes from keyword-research tooling, pulling average monthly search volume for 42 major car brands across 171 countries.
One brand, most of the map
Toyota is the single most common leader by country count, topping search in most of North America, Australia, and a wide band of Africa — consistent with its position as the world's largest automaker by sales volume, a reputation for reliability that translates directly into "which Toyota model should I buy" being a common search query. Hyundai's territory looks larger on the map than its country count would suggest, because one of its markets is Russia, the world's largest country by land area.
Reading the smaller markets
The more interesting story is often in the smaller, denser clusters: Tesla dominating China outright and BMW holding Japan in East Asia, while Western Europe itself splits across far more brands than just those two — Mercedes-Benz, Renault, Volvo, Hyundai and Peugeot each hold their own countries there. Tesla's search dominance tracks a real product edge: the Model S Plaid posted an EPA-rated range over 400 miles on a single charge, among the longest of any production EV. Honda holds Southeast Asia. Latin America is a three-way split, not two: Honda’s own Brazil is the single biggest piece, with Chevrolet and Hyundai dividing most of the rest between Mexico, the Andes and the Southern Cone. Search interest here reflects a mix of what's actually sold locally, what's aspirational, and what's newsworthy at the time the data was pulled — a launch, a recall, or a viral story can move a country's top search for months without changing what's actually parked in driveways.
Frequently asked questions
Does this map show which cars sell the most, or which cars people search for?
Search interest, not sales. The map answers a narrower question than it looks like: not which brand sells the most cars in each country, but which brand people search for most on Google. A brand can dominate search interest without dominating the road, and vice versa.
Why does Toyota lead more countries than any other brand?
Toyota tops search in most of North America, Australia and a wide band of Africa, consistent with its position as the world’s largest automaker by sales volume. Its reputation for reliability also translates directly into common searches like “which Toyota model should I buy.”
Why does Hyundai's territory look so large on the map if it doesn't lead in many countries?
Because one of its markets is Russia, the world’s largest country by land area. Hyundai’s shaded territory looks bigger than its actual country count would suggest for that reason alone.
How many countries and car brands does the underlying data cover?
The data covers 171 countries and tracks average monthly search volume for 42 major car brands.
Which brands lead in the smaller, denser markets?
In East Asia, Tesla dominates China outright and BMW holds Japan — but Western Europe itself splits across far more brands than just those two, with Mercedes-Benz, Renault, Volvo, Hyundai and Peugeot each holding their own countries there. Honda holds Southeast Asia. Latin America is really a three-way split: Honda’s own Brazil is the single biggest piece, with Chevrolet and Hyundai dividing most of the rest between Mexico, the Andes and the Southern Cone.
Can a country's top search change without its actual car ownership changing?
Yes. Search interest here reflects a mix of what’s actually sold locally, what’s aspirational, and what’s newsworthy at the time the data was pulled — a launch, a recall or a viral story can move a country’s top search for months without changing what’s actually parked in driveways.
Sources
Average monthly Google search volume across 171 countries, 42 car brands — methodology and map as credited on the original infographic, published by veygo (2018).